

This article is for educational and informational purposes only. It is not financial, investment, tax, legal, or individualized advisory advice. Markets involve risk, and every reader should consider personal goals, time horizon, financial condition, and risk tolerance before making investment decisions.
The stock market has a way of making people feel late, confused, and slightly guilty for not already knowing what to do.
One day the market is up because inflation is cooling. The next day it is down because inflation is still too high. A week later the same news is suddenly bullish again because investors think the Federal Reserve may change course. Turn on financial television long enough and you may feel like every move has a simple explanation. It usually does not.
Markets are not moved by one headline at a time. They are moved by layers: liquidity, interest rates, earnings expectations, inflation pressure, credit conditions, currency movement, investor positioning, sector rotation, and human emotion. The daily news usually explains yesterday’s move after it already happened. A useful current market overview does something better. It helps you understand the big picture before emotion takes over.
That is the purpose of this free Investment article series. Six Stone Jars is not here to chase every headline or repeat market chatter. The goal is to help readers step back, see the market structure, and ask better questions: What is trending? What is weakening? Where is risk rising? Where is capital moving? And what should a disciplined investor watch next?
[INTERNAL LINK: Future Investment article – Retail vs. Professional Investors: Ignore the Shiny Objects and Avoid the Typical Traps]
Table of Contents
Why Daily Market Headlines Usually Mislead Investors
The financial media has a difficult job. It must explain every move, every day, in a way that sounds immediate and confident. That creates a problem. Markets are complex, but headlines prefer simplicity.
If the S&P 500 rises, the explanation may be optimism about earnings. If it falls the next day, the explanation may be fear over rates. If it rises again, the story may be bargain hunting, artificial intelligence excitement, or relief that a piece of bad news was not worse. Some of those explanations may contain truth. But they are often too shallow to guide a serious investment decision.
A professional market perspective begins by refusing to confuse explanation with understanding. The explanation is the story attached to a move. Understanding comes from the evidence beneath the move.
That means asking whether the trend is healthy or narrow. Are multiple sectors participating, or are a few large names carrying the index? Are bonds confirming confidence, or warning about stress? Is the dollar rising in a way that pressures commodities and multinational earnings? Are credit spreads calm or widening? Are investors buying strength with conviction, or merely bouncing from oversold conditions?
Those questions do not fit neatly into a two-minute market segment. But they are the questions that matter.
The Big Picture Matters More Than the Last Move
A market can be up today and still weakening. It can be down today and still in a longer-term uptrend. That sounds contradictory until you learn to separate timeframe.
Short-term moves are noisy. They are shaped by news, positioning, options flows, headlines, fear, greed, and forced buying or selling. Longer-term trends reveal something different: whether capital is accumulating or distributing, whether leadership is broadening or narrowing, and whether risk appetite is expanding or shrinking.
A good weekly market overview should not try to predict every tick. It should help you locate yourself on the map.
Are we in a constructive trend? A choppy range? A possible topping process? A risk-off environment? A recovery attempt? A market can move through all of those phases, and each phase requires a different mindset. The danger is treating every phase the same.
That is where many retail investors get hurt. They become excited after a move is already extended. They become fearful after a decline has already done most of its damage. They react to the emotional temperature of the moment instead of the structure of the market.
[INTERNAL LINK: Future Featured Free article – Long-Term vs. Short-Term Investing: Avoid the Noisy News and Keep Your Eye on the Prize]
What a Free Weekly Market Overview Should Cover
A free weekly market overview does not need to overwhelm you with professional jargon. It should give you a clean dashboard of what matters most. The point is not to turn you into a trader. The point is to help you stop making emotional decisions from noisy inputs.
For Six Stone Jars, the free weekly Investment overview will cover several core points.
1. Major Index Direction
Start with the obvious, but do not stop there. Are the major stock indexes rising, falling, or moving sideways? Are they above or below important moving averages? Are they making higher highs and higher lows, or showing signs of fatigue?
The goal is not to worship technical levels. The goal is to understand market posture. If the major indexes are trending higher with broad participation, the market is behaving differently than if the indexes are drifting higher on the strength of a few mega-cap names while most stocks weaken underneath.
2. Trend Strength and Market Breadth
Market breadth answers a simple question: how many stocks are actually participating? A healthy market usually has more than a narrow handful of winners. A weak market can hide under a strong index if only a few large companies are pulling the average higher.
This matters because breadth often reveals internal strength or weakness before the casual observer notices it. A free SSJ market overview can explain whether the market’s strength appears broad, narrow, improving, or deteriorating.
3. Sector Leadership
Money does not move evenly. It rotates. Some weeks technology leads. Other weeks energy, financials, industrials, healthcare, utilities, or consumer staples take the lead. Sector rotation helps answer an important question: are investors seeking growth, defense, inflation protection, yield, or safety?
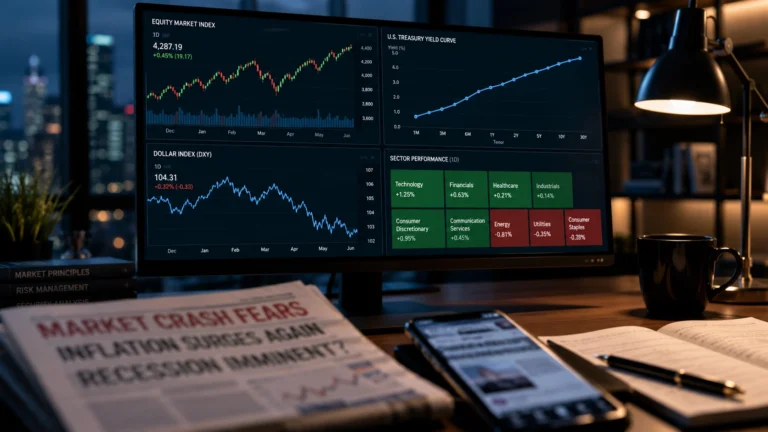
A simple weekly table can show which sectors are strong, which are weak, and whether leadership supports a risk-on or risk-off interpretation. This is one of the easiest ways to make the free Investment article useful.
4. Bonds and Interest Rates
Stocks do not trade in isolation. Interest rates matter because they influence borrowing costs, valuation, housing, corporate financing, and investor appetite for risk. When bond yields rise quickly, stocks often have to reprice expectations. When yields fall because growth is weakening, that can also be a warning sign.
A weekly overview should watch Treasury yields, the shape of the yield curve, and whether bond behavior supports or contradicts the stock market’s message. The U.S. Treasury publishes daily yield curve rates, and FRED provides long-running economic and market data that can help you see these relationships over time.
5. The Dollar and Foreign Exchange
The dollar is another key signal. A rising dollar can pressure commodities, emerging markets, foreign earnings, and global liquidity. A falling dollar may support risk assets or reflect changing rate expectations. Neither is automatically good or bad. Context matters.
At the free level, Six Stone Jars will provide a plain-English read on the dollar’s trend and what it may mean for stocks, bonds, commodities, and foreign exchange markets.
6. Volatility and Risk Appetite
Volatility is not just a scary number on a screen. It reflects uncertainty, positioning, and market stress. FINRA describes volatility as the degree of market swing and notes that more dramatic moves can signal higher potential risk. That makes volatility useful as a risk-awareness tool, not a reason to panic.
The question is not simply whether volatility is high or low. The better question is whether volatility is rising from complacent levels, falling after stress, or remaining elevated while investors pretend conditions are normal.
7. Economic Backdrop
Even a free article can provide a short macroeconomic snapshot: inflation, employment, growth, consumer pressure, credit conditions, and central bank posture. This will be brief, but it will remind you that markets respond to the economy, policy, liquidity, and expectations together.
Free readers will receive the high-level summary which allow one to stay connected and balanced amid a sea of conflicting news information. Investment Members will receive the heavier dashboard work: leading indicators, yield curve analysis, liquidity, inflation history, debt pressure, foreclosure trends, and business-cycle interpretation.
[INTERNAL LINK: Future Investment Member article – Economic Analysis: Macro-Economic Indicators and Current Market Impact]
8. Investor Discipline
The final weekly point may be the most important: what should investors avoid doing emotionally?
Sometimes the right answer is not to buy, sell, panic, chase, or predict. Sometimes the right answer is to observe, prepare, and wait for better evidence. That may not sound exciting, but it is often where investment wisdom begins. Investor.gov emphasizes that asset allocation depends on time horizon and risk tolerance, and FINRA warns that volatile markets can trigger fear and anxiety. Those are not side issues. They are central to real-world investing.
A weekly market overview will therefore help you stay steady. Not passive. Not asleep. Steady.
What Six Stone Jars Can Provide at the Free Level
The free Investment level will give you a clear, useful market orientation each week. It will help you know what kind of environment you are in without requiring you to decode every chart, speech, data release, or professional research report on your own.
A practical free weekly structure may include:
- Market posture: bullish, bearish, neutral, or mixed.
- Trend summary: major stock indexes, bond yields, the dollar, and key commodities.
- Sector snapshot: which areas are leading and lagging.
- Risk tone: risk-on, risk-off, or transition.
- Key macro watchpoints: inflation, jobs, rates, credit, liquidity, or consumer pressure.
- Investor discipline note: what to avoid emotionally this week.
That is enough insight to provide genuine value for those who are at this level of market experience or participation. Opportunities exist upgrade your membership to Standard Member or Investment Member to receive a deeper and broader understanding of the market along with specific investment signals.
How This Leads Into Standard and Investment Membership
The free article will answer the first question: what is the market broadly doing?
The Standard Member level will answer the next question: what are informed market participants saying, what is moving across stocks, bonds, the dollar, and foreign exchange, and what sectors or industries deserve attention?
The Investment Member level will go deeper still: are the technical signals confirming the macro backdrop? Are leading indicators improving or weakening? Are professionals already engaged? Is liquidity supportive? Is the cycle early, late, or deteriorating? Is a popular stock idea actually well-timed, or is it another expensive newsletter pitch dressed up as urgency?
That is the value ladder. Free readers receive orientation. Standard Members receive increased context. Investment Members receive specific macro-economic details and investment signals.
[INTERNAL LINK: Future Standard Member article – Weekly Market Analysis: Stock Index, Dollar Index, Bond Index, and Foreign Exchange]
A Simple Weekly Market Overview Framework
To make the publishing and newsletter cycle practical, Six Stone Jars will use a repeatable framework. Consistency will matter more than complexity.
A weekly free overview will generally use this format:
- 1. One-sentence market summary: What changed this week?
- 2. Market posture: Bullish, bearish, neutral, or mixed.
- 3. Major indexes: Trend and key behavior.
- 4. Bonds and rates: Confirming or warning?
- 5. Dollar and FX: Strength, weakness, and implications.
- 6. Sector leadership: Hot, improving, weak, or defensive.
- 7. Macro note: One or two data points that matter.
- 8. Investor discipline: What not to overreact to.
- 9. What to watch next week: The most important signals ahead.
This will become the rhythm of the free Investment newsletter so you can depend on the information and you will know what to expect. It also makes the deeper, paid levels easier to understand because you already know the structure.
Conclusion: Do Not Let the Market Tell You How to Feel
The market will always provide reasons to feel something. Excited. Afraid. Late. Brilliant. Foolish. Vindicated. Regretful. That emotional machinery is part of what makes investing difficult.
A current market overview should not make you more reactive. It should make you steadier. It should replace scattered headlines with a professional big-picture view. It should help you ask better questions before you make investment decisions.
That is the promise of the Six Stone Jars Investment pillar: less noise, more signal; less emotional reaction, more disciplined perspective. The free level begins with orientation. The deeper levels build toward analysis, timing, risk awareness, and actionable market intelligence.
The market may be up today or down tomorrow. That is not the real question. The real question is whether you understand what kind of environment you are in, what signals matter, and what should be ignored.
Closing CTA
Start with the big picture. Before reacting to the next headline, ask what the market is actually showing across trend, breadth, bonds, rates, the dollar, sectors, and risk appetite. Then use the Six Stone Jars Investment articles to build a steadier framework for decision-making.
Source and Fact-Checking Notes
The following sources were used to support key claims, provide market context, and help readers examine the topic more deeply. This article is educational and should not be treated as personalized financial advice.
- FRED – Federal Reserve Economic Data — Economic and market data hub for inflation, unemployment, GDP, rates, and related indicators.
- U.S. Treasury – Daily Treasury Par Yield Curve Rates — Official source for U.S. Treasury yield curve rates.
- Investor.gov – Asset Allocation 101 — Investor education on asset allocation, time horizon, and risk tolerance.
- Investor.gov – Diversification — Investor education on diversification and spreading risk.
- FINRA – Volatility — Explains market volatility and risk.
- FINRA – Investor Tips for Turbulent Markets — Guidance on remaining disciplined during market volatility.
- Federal Reserve – Industrial Production and Capacity Utilization — Official current industrial production data release.
- New York Fed – Outlook-at-Risk — Research-based framework for growth, unemployment, and CPI risks.
- SEC Investor.gov – Home — General investor education and investor protection resources.
- Bible Gateway – Proverbs 21:5 — Wisdom principle supporting planning and disciplined decision-making.
