

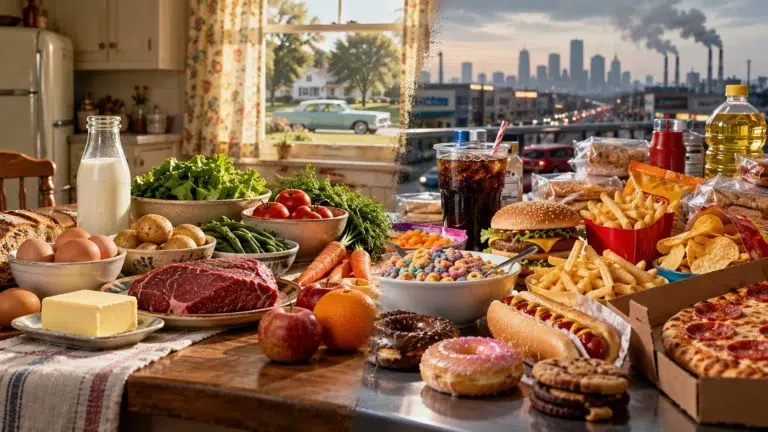
The American diet since 1960 changed in ways that are easy to feel but harder to measure cleanly. The typical grocery store became larger. Food became cheaper relative to income. Restaurants and fast food became routine. Portions grew. Industrial ingredients multiplied. Cooking shifted toward convenience. And a growing share of calories came from foods designed to be shelf-stable, portable, highly palatable, and easy to eat quickly.
It is tempting to tell that story with one villain: sugar, high-fructose corn syrup, seed oils, fast food, refined grains, or processed food. The historical data do not support such a simple explanation. What they show is a food environment that changed in several directions at once.
That matters because obesity and chronic metabolic disease also rose dramatically across the same broad era. But timing alone does not tell us which ingredient caused which disease. A stronger approach is to ask two separate questions: What objectively changed in the food supply? And which of those changes have the strongest evidence that they influence appetite, calorie intake, weight, and health?
This article is a direct companion to Why Has Our Health Declined in the Last 60 Years?, which examined the larger stack of pressures affecting modern health. Here we isolate one piece of that story: the food environment.
Table of Contents
First, a Data Warning: ‘Available to Eat’ Is Not the Same as ‘Actually Eaten’
Much of the best long-term U.S. food-history data comes from USDA’s Economic Research Service. Its Food Availability system estimates how much food enters the human food supply after accounting for production, imports, exports, nonfood uses, stocks, and — in the loss-adjusted series — estimates of spoilage, waste, and other losses.
That makes the series valuable for long-term direction. It is not the same as putting every American on a scale and measuring every bite. USDA itself cautions that availability data are proxies for consumption.
That distinction is especially important when comparing eras. Measurement systems, commercial reporting, food waste, and the food industry itself changed. The safest use of the data is to identify broad shifts, not pretend every historical calorie estimate is exact to the last calorie.
The Food Supply Became More Calorie-Dense and More Abundant
One of the clearest USDA findings is simply that more food energy became available.
Using its historical loss-adjusted series, USDA estimated about 2,234 calories available per person per day in 1970 and 2,757 calories in 2003 — an increase of roughly 523 calories per person per day. That does not mean the average American literally swallowed 523 additional calories every day. It does mean the food environment was supplying substantially more edible energy.
| USDA Food-Supply Measure | 1970 | 2003 | Change / Contribution |
| Loss-adjusted calories available per person/day | 2,234 kcal | 2,757 kcal | +523 kcal/day |
| Added fats and oils | 53 lb/person | 86 lb/person | +63%; ~216 of added daily calories |
| Grains | 136 lb/person | 194 lb/person | +43%; ~188 of added daily calories |
| Sugars and sweeteners | 119 lb/person | 142 lb/person | +19%; ~76 of added daily calories |
| Meat, eggs, nuts | 226 lb/person | 242 lb/person | +7% |
| Vegetables | 337 lb/person | 418 lb/person | +24% |
| Fruit | 242 lb/person | 275 lb/person | +12% |
Notice what the table does not say. Americans did not stop eating fruits and vegetables. Availability of both rose. The problem is that energy-rich categories rose as well, and the added calories were concentrated heavily in fats/oils, grains, and sweeteners.
| “The modern diet did not change because one food appeared. It changed because the whole eating environment became more abundant, more processed, more convenient, and easier to overconsume.” |
Added Fats and Oils Rose Sharply
USDA’s historical series estimated that added fats and oils availability increased about 63% between 1970 and the early 2000s. The agency calculated that this category alone accounted for roughly 216 calories of the 523-calorie increase in its 1970–2003 loss-adjusted comparison.
That does not mean dietary fat as a nutrient is inherently harmful. Fats are essential, and different fats have different metabolic effects. It also does not prove that ‘seed oils caused obesity.’ The historical measure is useful because it shows how much additional energy entered the food supply through added fats and oils, especially in commercially prepared and packaged foods.
Fats are calorically dense: roughly nine calories per gram. A few tablespoons added invisibly through frying, dressings, sauces, baked goods, chips, restaurant meals, and packaged foods can increase meal energy substantially without increasing food volume proportionally.
Grains Increased — Mostly in a Refined-Food Environment
Grain availability increased about 43% between 1970 and 2003 in the USDA comparison. Grain itself is not the problem. Whole grains can provide fiber, minerals, and useful carbohydrate.
The practical issue is what form grain takes. Refined flour became a foundation for breads, pizza, crackers, breakfast products, desserts, snack foods, fast-food buns, tortillas, and countless mixed dishes. In many of those foods, refined grain arrives together with added fats, salt, sugar, cheese, processed meats, and large portions.
This is why ingredient debates often miss the food-system issue. A slice of whole-grain bread eaten with a meal is not metabolically or behaviorally identical to a large pastry, a bag of snack crackers, or a fast-food meal just because all contain grain.
The Sweetener Story Changed Dramatically
Between 1970 and 2005, USDA estimated total caloric sweetener availability increased about 19%, from roughly 119 to 142 pounds per person per year before loss adjustment.
But the composition changed even more dramatically. Refined cane and beet sugar availability fell, while corn sweeteners surged. High-fructose corn syrup was essentially negligible in 1970 and rose to roughly 59 pounds per person in 2005 availability data, after peaking around the end of the 1990s.
HFCS became attractive to food and beverage manufacturers because it was inexpensive, functional in beverages, and easy to incorporate into processed foods. It became especially visible in soft drinks.
But an important correction belongs here: HFCS later declined from its peak. Obesity did not simply reverse with it. That is one reason the evidence does not support treating high-fructose corn syrup as the single explanation for the obesity epidemic. Added sugars matter, especially in beverages and calorie-dense foods, but the broader energy and food environment matters more than one sweetener.
Portions Became Larger
The American diet also changed in the size of what counted as one serving.
A nationally representative analysis comparing dietary surveys from 1977–1978 through the 1990s found that portion sizes increased for many commonly consumed foods both inside and outside the home. Between 1977 and 1996, average soft-drink portions rose from about 13.1 to 19.9 fluid ounces. Hamburger portions increased from about 5.7 to 7.0 ounces. Salty-snack portions rose from about 1.0 to 1.6 ounces. French fries and Mexican-food portions also increased.
This matters because humans often respond to the amount served. Larger default portions can increase energy intake without anyone consciously deciding to ‘eat more calories.’ The environment makes the larger amount look normal.
More Food Moved Out of the Kitchen
Another structural change is where Americans spend their food dollars.
USDA’s long-running Food Expenditure Series shows the growth of food away from home — restaurants, fast-food outlets, schools, hotels, and other prepared-food settings. By 2024, food-away-from-home expenditures accounted for 58.9% of total U.S. food spending, a record high in the series.
Spending is not the same as calorie volume because restaurant food includes labor and service costs. Still, the trend captures a major cultural shift: more of the food economy now passes through commercial preparation rather than the household kitchen.
Commercial food does not have to be unhealthy. But restaurants and prepared foods commonly have strong incentives for taste, convenience, repeat purchase, portion value, and consistency — not necessarily for fiber, modest energy density, or long-term metabolic health.
That incentive structure is explored further in How to Prevent Commercial Interests from Stealing Your Health.
Ultra-Processed Foods Now Supply Most Calories
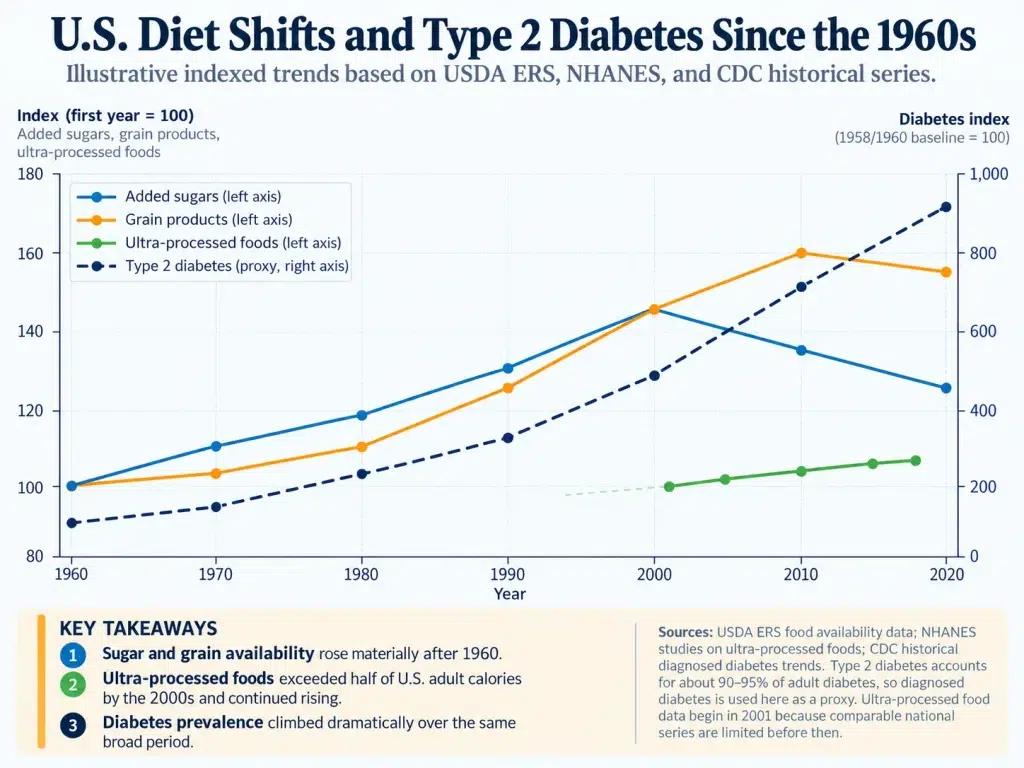
The most striking modern snapshot may be ultra-processed food.
In August 2021 through August 2023, CDC’s National Center for Health Statistics estimated that ultra-processed foods supplied 55.0% of calories for Americans age one and older. Among adults, the share was 53.0%. Among youth ages 1–18, it was 61.9%.
| Population | Mean Share of Calories From Ultra-Processed Foods | Recent CDC Estimate |
| All age 1+ | 55.0% | August 2021–August 2023 |
| Adults age 19+ | 53.0% | August 2021–August 2023 |
| Youth age 1–18 | 61.9% | August 2021–August 2023 |
| Children age 6–11 | 64.8% | August 2021–August 2023 |
The largest ultra-processed calorie sources were not obscure laboratory products. They were familiar foods: sandwiches and burgers, sweet bakery products, sweetened beverages, savory snacks, pizza, and breads or rolls.
The classification is not perfect. ‘Ultra-processed’ is a broad category, and foods within it differ nutritionally. Recent CDC data also show that the adult UPF share has declined modestly since 2013–2014. The point is not that everything packaged is toxic. The point is that industrially formulated food now supplies a majority of calories in the average U.S. diet.
Does Processing Itself Make People Eat More?
Observational studies can be confounded: people who eat more ultra-processed food may differ in income, activity, smoking, sleep, and other behaviors. That is why an NIH inpatient randomized trial is especially useful.
In the 2019 trial led by Kevin Hall, 20 adults lived in a research center and were assigned for two weeks each to ultra-processed and minimally processed diets matched on presented calories, macronutrients, sugar, sodium, and fiber. Participants were allowed to eat as much or as little as they wanted.
On the ultra-processed diet, participants ate roughly 500 more calories per day and gained weight; on the unprocessed diet, they ate less and lost weight. The study was short and small, so it does not settle every question about processing. But it provides unusually direct evidence that food form and eating environment can affect spontaneous calorie intake even when many nutrient targets are matched.
| “A diet can be ‘nutritionally similar’ on paper and still behave differently in the real world if one version is easier to eat quickly, easier to overconsume, and less satiating.” |
Obesity Rose at the Same Time — but Correlation Is Not a Verdict
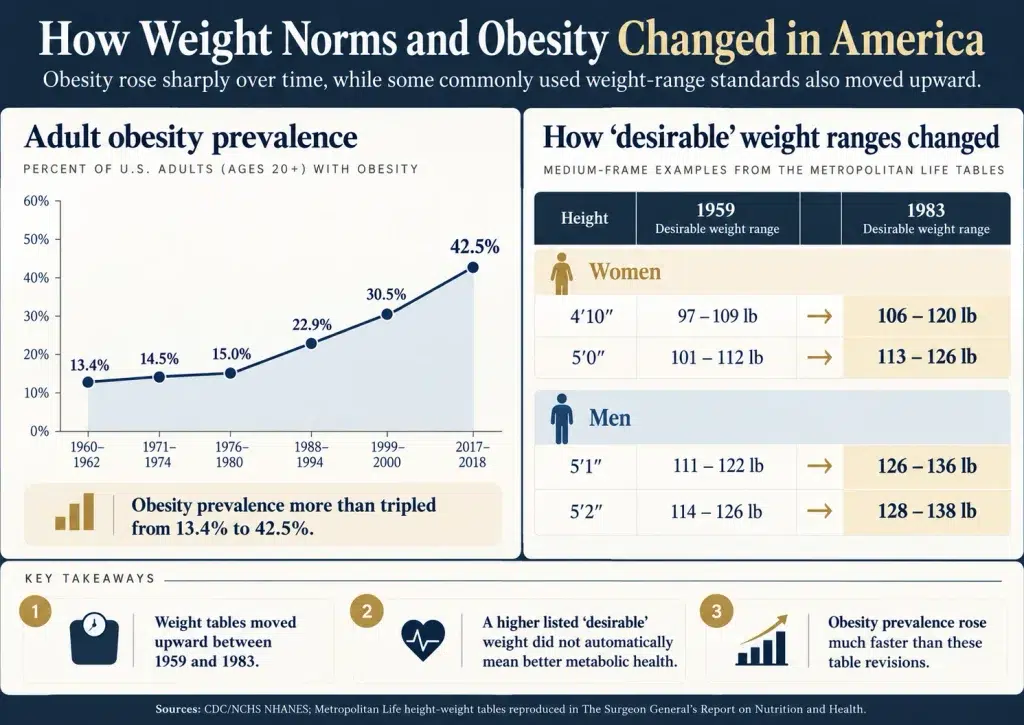
The population outcome is difficult to ignore. CDC’s February 2026 historical update reports that age-adjusted obesity prevalence among U.S. adults ages 20–74 was 13.4% in 1960–1962. For adults age 20 and older in August 2021 through August 2023, obesity prevalence was 40.3%.
Those two percentages use slightly different age ranges because the early surveys did not include the full older-age population, so they should not be treated as a perfectly matched before-and-after experiment. The direction, however, is unmistakable: adult obesity became much more common.
As Americans became heavier, widely used height-weight standards also shifted upward. The 1983 Metropolitan Life tables raised many recommended weight ranges compared with the 1959 version, reflecting newer mortality data — but the revision was controversial because a higher weight associated with similar survival did not necessarily mean better metabolic health.
A National Academies/Surgeon General comparison makes the change very concrete. For example, for women around 4’10”, the 1959 medium-frame range was roughly 97–109 lb, while the 1983 range was about 106–120 lb. At 5’0″, the 1959 medium-frame range was about 101–112 lb, versus roughly 113–126 lb in the 1983 tables. This is a big change in ‘normal weight’ measurement in a relatively short period of time. What changed?
It would still be a mistake to say the dietary changes above ‘prove’ why. Physical activity, occupational movement, smoking, sleep, medications, age structure, economics, genetics interacting with environment, stress, and many other factors changed too.
The stronger conclusion is that the food environment shifted in ways that make sustained positive energy balance easier — more edible energy, bigger portions, more restaurant food, more highly processed foods, and more foods designed for convenience and repeated consumption.
What Did Not Change the Way the Nostalgia Story Suggests
A fair historical article also has to resist romanticizing the past.
- Smoking rates were much higher in earlier decades.
- Trans fats from partially hydrogenated oils became widespread and were later recognized as harmful.
- Nutrition knowledge, food safety, emergency medicine, and treatment of cardiovascular risk improved.
- Earlier diets were not automatically rich in vegetables, whole grains, or micronutrients.
- Some modern convenience foods are genuinely useful, safe, and nutritionally reasonable.
- Fruit and vegetable availability also increased in USDA’s historical data.
- Food became cheaper relative to disposable income over much of the period, improving access and reducing the household burden of food spending.
The useful lesson is not ‘eat like it is 1960.’ It is to identify which features of the earlier food environment reduced passive overconsumption and which modern advances are worth keeping.
The Most Important Change May Be Food Structure
When the long-term trends are placed together, the common thread is not one molecule. It is food structure.
Meals increasingly moved from recognizable ingredients toward combinations that are easy to chew, easy to swallow, portable, shelf-stable, highly flavored, and repeatedly available. More calories can be consumed in less time and with less preparation.
That does not make industrial food morally bad. It does mean the modern eater has to practice intentionality that an earlier food environment sometimes supplied automatically through inconvenience: cooking, chewing, sitting down, waiting, washing dishes, and having fewer snack opportunities.
A Practical Return to Food That Behaves Like Food
You do not need a 1960s kitchen, a farm, or an expensive supplement program. A useful reset is much simpler.
- Build most meals around minimally processed protein, vegetables, fruit, legumes, whole grains or other intact starches, and appropriate fats.
- Cook at home often enough that restaurant and packaged foods are choices rather than defaults.
- Prioritize protein and fiber because they add structure and satiety to meals.
- Drink most calories rarely; water, unsweetened coffee or tea, and other low-calorie beverages make overconsumption harder.
- Treat desserts, chips, sweet bakery products, and snack foods as foods — not moral failures — but avoid letting them become meal replacements.
- Use package labels to notice serving size and calories, especially in foods that are easy to eat directly from the container.
- Be skeptical of health halos. Organic, gluten-free, vegan, keto, high-protein, or ‘natural’ labels do not automatically make an ultra-processed product a good dietary foundation.
- Make convenience work for you: frozen vegetables, canned beans, rotisserie chicken, plain yogurt, nuts, eggs, pre-cut produce, and simple prepared ingredients can reduce cooking friction without turning the diet into snack food.
Conclusion: The Diet Changed More Than the Individual
Americans did not collectively wake up one morning and lose their willpower. They entered a food environment with more available calories, larger default portions, more commercially prepared food, more refined ingredients, and a majority of calories now coming from ultra-processed foods.
Personal responsibility still matters. But responsibility becomes more realistic when we understand the environment we are navigating.
The lesson from the last 60 years is not that every modern food is bad or every traditional food is good. It is that convenience, abundance, processing, and portion size changed the default. If the default encourages overconsumption, health stewardship requires rebuilding better defaults at home.
| “The most useful question is not, ‘Which modern ingredient should I fear?’ It is, ‘What kind of food environment makes healthy eating easier by default?’” |
Source and Fact-Checking Notes
- USDA ERS — U.S. Food Consumption Up 16 Percent Since 1970 — Historical loss-adjusted comparison: calories rose from 2,234/day in 1970 to 2,757/day in 2003; added fats/oils +63%, grains +43%, sugars/sweeteners +19%. Availability is a proxy, not direct measured intake. Source
- USDA ERS — Dietary Assessment of Major Trends, 1970–2005 — Detailed historical tables for fats/oils, grains, sweeteners, dairy, meat, fruits, vegetables; documents the sharp substitution toward corn sweeteners / HFCS. Source
- USDA ERS — High-Fructose Corn Syrup Usage May Be Leveling Off — HFCS introduced in late 1960s; availability rose sharply, peaked around 1999, then leveled / declined, useful for avoiding single-cause obesity claims. Source
- CDC/NCHS 2025 — Ultra-Processed Food Consumption — August 2021–August 2023: 55.0% total calories age 1+, 61.9% youth, 53.0% adults; identifies top UPF calorie sources and recent modest declines. Source
- CDC/NCHS 2026 — Historical Obesity Prevalence — Age-adjusted obesity ages 20–74 was 13.4% in 1960–1962; obesity age 20+ was 40.3% in August 2021–August 2023. Age-range difference is explicitly acknowledged. Source
- Nielsen & Popkin 2003 — Portion Size Trends — National survey comparison: many common portion sizes increased between 1977 and the 1990s, including soft drinks, snacks, hamburgers, fries, and Mexican foods. Source
- Hall et al. 2019 — NIH Randomized Feeding Trial — 20-person inpatient crossover trial: ultra-processed diet caused ~500 kcal/day greater ad libitum intake and weight gain versus minimally processed diet; strong short-term causal evidence with limited duration/sample. Source
- USDA ERS — Food Prices and Spending — 2024 food-away-from-home expenditures reached 58.9% of total food expenditures; spending is not equivalent to calorie quantity but documents a major shift in food preparation channels. Source
Sources and Further Reading
- USDA ERS — Food Availability Data System — Read
- USDA ERS — Dietary Assessment, 1970–2005 — Read
- CDC/NCHS — Ultra-Processed Food Consumption, 2021–2023 — Read
- CDC/NCHS — Obesity Trends 1960–2023 — Read
- NIH / Cell Metabolism — Ultra-Processed Diet Randomized Trial — Read
- PubMed — Portion Size Trends 1977–1998 — Read
Closing CTA
Try one week of changing the food environment rather than relying on willpower. Plan several simple meals, keep minimally processed foods visible and ready, reduce liquid calories, serve snacks in a bowl instead of from the package, and cook at home more often than usual. Notice whether eating becomes easier to regulate when the environment changes first.
Disclosure
This article is educational and does not provide individualized medical or nutrition advice. Historical USDA food-availability data estimate the food supply and are not direct measures of individual intake. Obesity and chronic disease have multiple causes, and population trends do not prove that any single ingredient or food category caused an individual condition. People with diabetes, eating disorders, kidney disease, food allergies, pregnancy-related nutrition needs, or other medical conditions should seek individualized guidance from a qualified clinician or dietitian.
